Rate context you can defend in the room.
Negotiated-rate observations from payer machine-readable files, anchored to Medicare — with the provider match, the file date, and a data-quality label attached to every figure.
Enterprise pricing is negotiated against your payer mix and seat count. A demo runs in the product, on your payers.
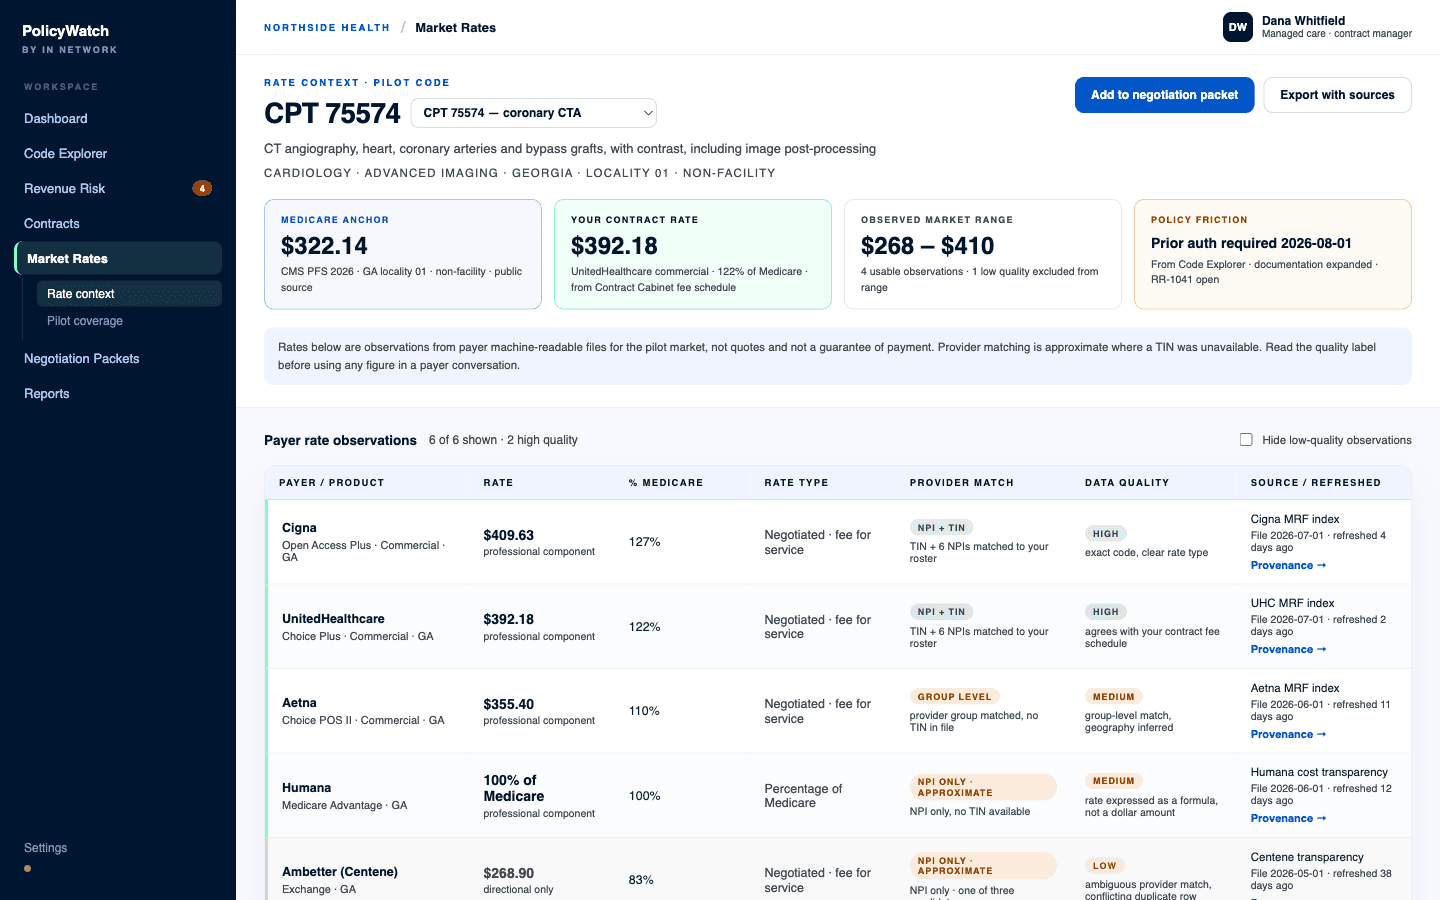
Market Rates for a single code, with provenance on every row.
Rates shown in PolicyWatch are observations published in payer machine-readable files. They are not a quote, and not a guarantee of payment. Provider matching is approximate wherever a TIN was unavailable, and every figure carries its source, file date and quality label so you can read the caveat before you use the number.
Observations from the payer's own published files
The numbers come from the machine-readable files payers publish under federal price-transparency rules — the payer's own disclosure, not a survey and not a model. A source registry keeps track of where each payer's files live, how often they change, and whether the last pull actually worked.
- Transparency page, index URL and file pattern tracked per payer
- Last checked, last successful pull, and update frequency on every source
- Ingestion and parser status, so a stale source is visible rather than silently missing
- Selective streaming filtered to your codes, your NPIs and TINs, and your markets
A Medicare anchor from public CMS sources
Every rate is shown against the Medicare amount for the same code, locality and setting, drawn from the CMS physician fee schedule. Percent of Medicare is the language payer contracting conversations are already conducted in, and it is the one benchmark both sides of the table can independently verify.
- CMS physician fee schedule anchor by code, locality and facility or non-facility setting
- Percent of Medicare on your own contract rate and on every observation
- Rates expressed by the payer as a percentage of Medicare are labeled as formulas, not converted into a dollar amount we invented
Provider matching, labeled honestly
Matching a rate in a payer file to your organization is the hard part of this data, and pretending otherwise is how a number ends up in front of a payer and falls apart. Every observation states how it was matched, and weaker matches are labeled rather than quietly averaged in.
- NPI plus TIN: matched against your roster
- Group level: provider group matched, no TIN in the file
- NPI only, approximate: no TIN available, geography or entity inferred
- Match strength is a visible column, not a hidden weighting
A data-quality label on every figure, with its reason
High, medium and low are not decorations — each label carries the sentence that explains it, and low-quality rows are excluded from the observed range rather than dragging it around. You can hide them entirely, and the range tells you how many observations it is built from.
- Reasons stated in the row: exact code and clear rate type, group-level match with inferred geography, ambiguous match with conflicting duplicate rows
- Observed range reports how many observations are usable and how many were excluded
- Low-quality observations can be hidden in one click
- Rate type and billing class shown alongside the amount — a professional component is never compared against a global rate
The provenance drawer: everything behind the number
Any figure opens into its own evidence: which file it came from, which index listed that file, when the payer published it, when we last refreshed it, which plan and product it applies to, and what scope the number covers. If a figure is going into a payer conversation, the person carrying it can see everything supporting it first.
- Source file and index, with the payer's publication date
- Last refresh, and the age of the observation in days
- Payer, plan, product, market and setting
- Export with sources, or send the code straight into a negotiation packet
Honest about coverage
Rate coverage is built market by market, payer by payer, and code by code — starting with the codes and payers our customers actually bill. Where an observation does not exist for your code, product or market, the product says so instead of substituting a national average and hoping. No naked numbers, and no implied completeness.
- Coverage is stated per code, payer and market rather than claimed globally
- Codes without usable observations are shown as such, with the Medicare anchor still available
- Nothing is displayed without a source, a date, a scope and a quality label
One source of truth, one loop.
Market Rates is the benchmark layer, and it is deliberately the least dramatic product in the suite: it exists so the other four can attach money to their arguments without anyone inventing a figure. Code Explorer shows rate context beside the prior-auth and documentation burden on a code, Contract Cabinet compares your uploaded fee schedule against the same anchor, the Revenue Risk Queue weighs changes on high-rate codes more heavily, and Negotiation Packets carry the observations, their sources and their quality labels into the room with you.
What buyers ask about Market Rates.
Is an observed rate a quote we can hold a payer to?
What if there is no usable data for our code?
Why exclude observations instead of averaging everything?
Put Market Rates on your payers.
Negotiated-rate observations benchmarked against Medicare — every figure with source, date, and quality.
Want to see it for yourself first? Try Policy Finder — free.